 by
by Introduction
In today’s data-driven world, information is generated every second. Businesses collect huge amounts of data from customers, websites, sales reports, and marketing campaigns. However, raw data alone cannot help organizations make decisions unless it is properly analyzed and presented. This is where data visualization becomes important.
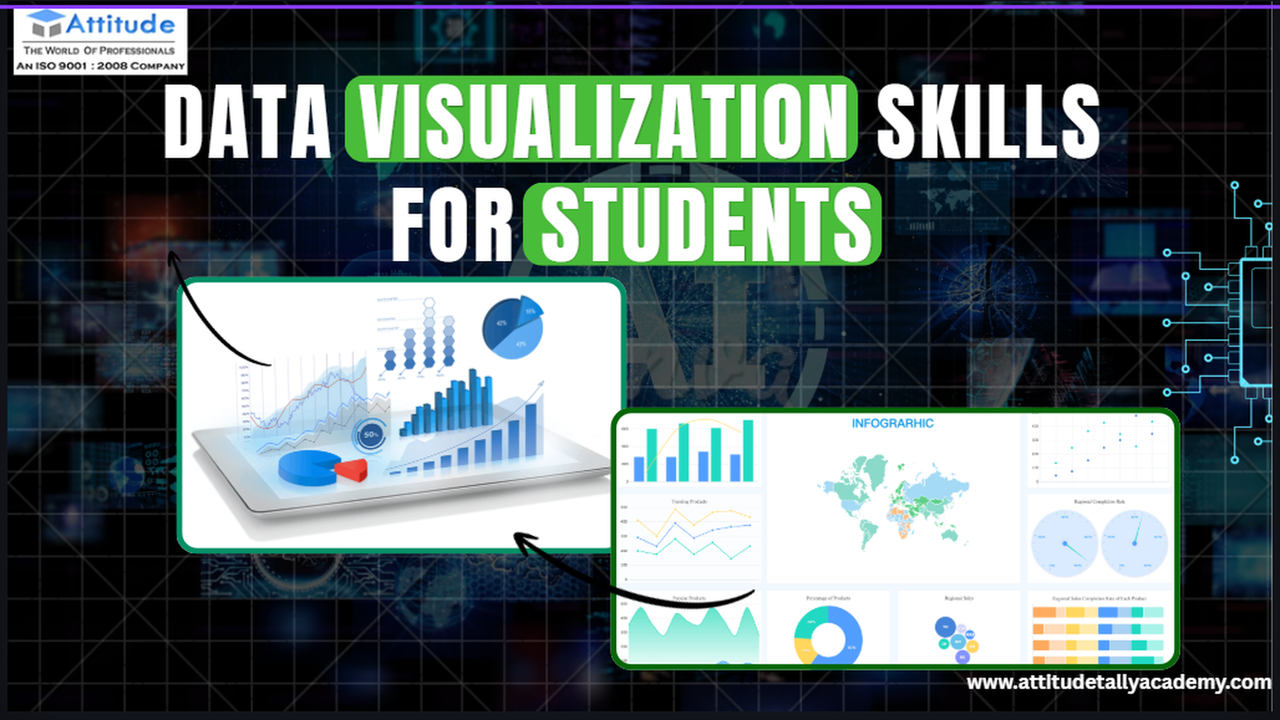
Data visualization is the process of presenting data in visual formats such as charts, graphs, dashboards, and reports. Instead of reading long spreadsheets, people can easily understand insights through clear visuals. For students interested in MIS and analytics, learning visualization skills is becoming an essential part of building a successful career.
Many learners exploring the best data analytics course often discover that data visualization is one of the most practical and valuable skills in the analytics field.
What is Data Visualization?
Data visualization converts complex data into simple visual formats so that trends and patterns become easier to understand. For example, a bar chart can quickly show sales performance across months, while a pie chart can explain how different categories contribute to overall revenue.
Students studying at a Data Analytics Training Centre in yamuna vihar usually begin with basic visualization tools such as Microsoft Excel before moving to advanced platforms like Power BI or Tableau. These tools help transform raw datasets into interactive dashboards that decision-makers can understand easily.
Visualization helps bridge the gap between technical data analysis and business decision-making.
Why Data Visualization is Important for Students
For students entering the analytics field, understanding data is only the first step. The real challenge is presenting insights in a way that others can easily understand.
Students pursuing training at a Data Analytics often learn how visual storytelling helps businesses identify opportunities and solve problems. A well-designed dashboard can reveal patterns that might remain hidden in large spreadsheets.
Data visualization skills also improve communication. Instead of explaining numbers through long reports, analysts can present clear visual insights that support better decision-making.
Key Data Visualization Skills Students Should Learn
Understanding Charts and Graphs
One of the first skills students learn is choosing the right type of chart. Different data types require different visual formats. For example, line charts are useful for showing trends over time, while bar charts help compare categories.
Students enrolled in a Data Analytics Course in uttam nagar practice working with multiple chart formats so they can present data clearly and effectively.
Learning Data Visualization Tools
Modern analytics relies on powerful visualization tools that allow professionals to create dynamic reports and dashboards. Tools such as Power BI, Tableau, and Excel dashboards are widely used across industries.
Students attending Data Analytics Classes often gain hands-on experience with these tools, learning how to connect datasets, create visuals, and design interactive dashboards.
Data Storytelling
Another important skill is data storytelling. Visualization is not only about charts; it is about explaining what the data means. A good analyst can highlight important trends and explain how those insights impact business decisions.
Students learning through data analytics courses for beginners in Yamuna Vihar often practice presenting their findings through dashboards and presentations. This skill helps them communicate effectively with managers and clients.
Understanding Data Cleaning
Before creating visualizations, data must be cleaned and organized. Incorrect or incomplete data can lead to misleading insights. Students studying at a Data Analytics usually learn how to prepare datasets before creating reports.
This step ensures that visualizations represent accurate and reliable information.
Career Benefits of Learning Data Visualization
Students who develop strong visualization skills can explore multiple career opportunities. Organizations in finance, marketing, healthcare, and technology rely on data analysts to interpret and present business data.
Students completing training at a Data Analytics Training Institute in uttam nagar often pursue roles such as data analyst, MIS executive, business analyst, or reporting analyst. These roles require professionals who can convert data into actionable insights through effective visual presentations.
Strong visualization skills also improve portfolio projects, which can help students stand out during job interviews.
Final Thoughts
Data visualization is becoming one of the most valuable skills in the analytics field. As businesses continue to rely on data-driven strategies, professionals who can analyze and present data clearly will always remain in demand.
With consistent practice and curiosity, students can transform complex datasets into meaningful insights and build a strong foundation for a successful career in MIS and data analytics.visit us
Suggested Links: