 by
by Introduction
If you want to turn boring data into meaningful insights, Power BI is one of the best tools to learn. It helps you create interactive dashboards where you can easily understand trends, compare data, and make smart decisions.
For students, learning Power BI is a great step toward building a career in data analytics. Those searching for a data analytics can quickly learn how to build dashboards step by step.
What is Power BI?
Power BI is a business intelligence tool used to visualize data. It allows you to connect data from different sources, clean it, and present it in the form of charts, graphs, and dashboards.
Students enrolled in a data analytics often start their journey with Power BI because it is easy to learn and highly useful.
Why Are Interactive Dashboards Important?
Interactive dashboards are not just about visuals—they help you understand data clearly and make better decisions.
Importance of dashboards:
- Show data in a simple and visual way
- Help track performance and trends
- Save time in analysis
- Make reports more professional
Students doing a data science and analytics in Yamuna Vihar or an advanced data analytics in uttam nagar learn how dashboards improve real-world reporting.
How Does Power BI Work?
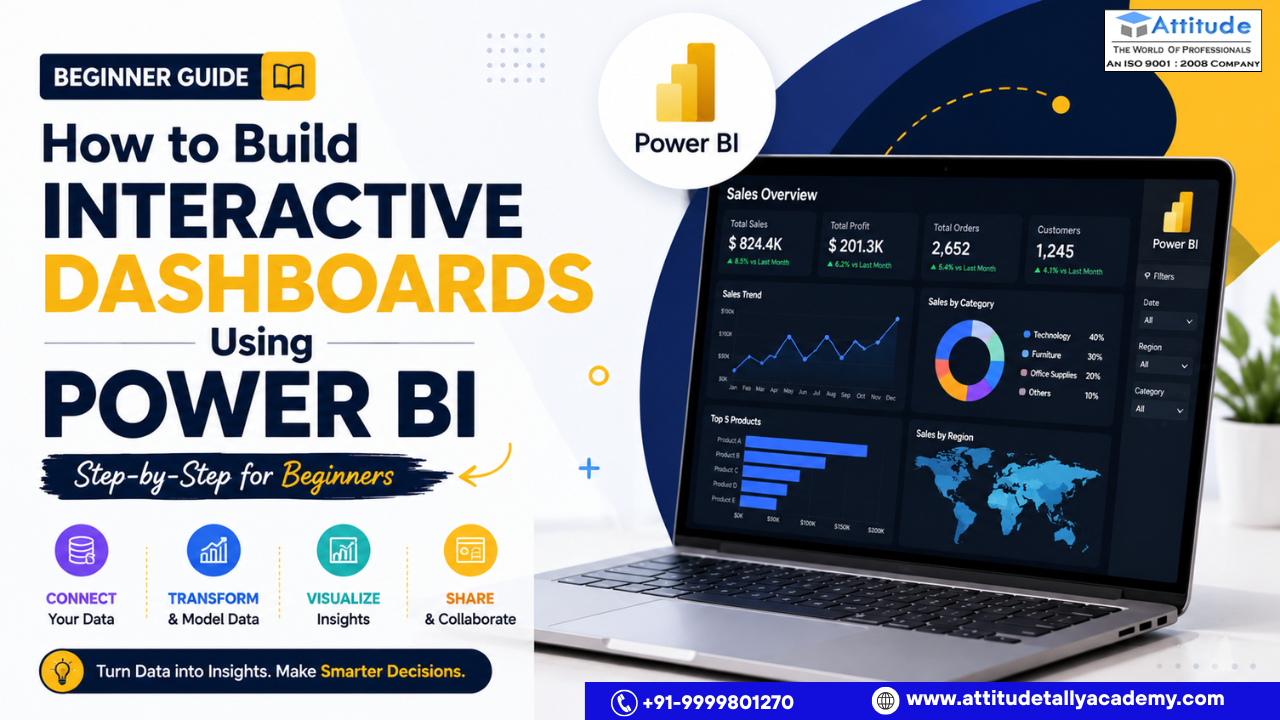
Power BI works in three simple steps:
1. Data Collection
You can import data from Excel, databases, or online sources.
2. Data Cleaning
Using Power Query, you can remove errors and organize data.
3. Data Visualization
Create charts, graphs, and dashboards using visual tools.
Students learning through a data analytics certification in Yamuna Vihar or a data analytics training in uttam nagar practice these steps regularly.
Step-by-Step Guide to Build a Dashboard in Power BI
Step 1: Import Your Data
Start by opening Power BI and importing your dataset (Excel file, CSV, etc.).
Students in a data analytics course in Yamuna Vihar or data analytics course in uttam nagar begin with simple datasets.
Step 2: Clean and Prepare Data
Use Power Query to:
- Remove duplicate values
- Fix missing data
- Format columns properly
This step is important for accurate results.
Step 3: Create Basic Visuals
Add charts like:
- Bar charts
- Pie charts
- Line graphs
These visuals help in understanding your data easily.
Step 4: Add Filters and Slicers
Filters and slicers make dashboards interactive.
- Users can select data based on category
- Helps in comparing different values
- Improves user experience
Students learning in a data analytics institute in uttam nagar use slicers to make dashboards dynamic.
Step 5: Design Your Dashboard
Arrange visuals properly:
- Keep layout clean
- Use proper titles
- Highlight important data
A well-designed dashboard looks professional and easy to understand.
Step 6: Share Your Dashboard
You can publish your dashboard online and share it with others.
Students completing a data analytics certification in uttam nagar or data science and analytics in Yamuna Vihar learn how to present their work professionally.
Benefits of Learning Power BI
Learning Power BI offers many advantages for students:
- Easy to learn for beginners
- Helps in data visualization
- Useful in multiple industries
- Improves analytical thinking
- Makes you job-ready
Career Opportunities After Learning Power BI
Power BI skills are in high demand today.
Job roles you can apply for:
- Data Analyst
- Business Analyst
- MIS Executive
- Reporting Analyst
- Data Visualization Specialist
Students completing a data analyst course online in Yamuna Vihar or a data analytics course in uttam nagar can explore these opportunities.
Tips for Beginners
If you are just starting, keep these tips in mind:
- Practice daily with small datasets
- Focus on understanding data, not just visuals
- Keep dashboards simple and clean
- Learn shortcuts to save time
- Work on real projects
Final Thoughts
Power BI is one of the best tools for students who want to build a career in data analytics. It helps you turn raw data into useful insights and present it in a professional way.
With regular learning and real projects, you can easily build interactive dashboards and become job-ready in the field of data analytics.Visit us