Excel & Power BI is not complex at all. Learn the Advanced Excel and Power BI & Create MIS Report by Practicing on real-time assignments & case studies.
☞ This workshop is for everyone, so don’t worry you don’t need to have any prior Excel Knowledge. Learn to how to analytics data and Manage reports
☞ If your looking to take your Excel skills from beginner to advanced level and beyond, and want to create dashboard. then this course is for you.
Yes! You will be certified by an Learn Data Analytics Instructor which brings a lot of credibility to your certificate & your resume.

The workshop is designed to be extremely convenient for students & working professionals to learn & manage work together.
You get access to daily video modules every day which you can watch anytime during the day at your convenience.
Live doubt solving sessions every alternate day where you will have all your questions answered. Recording will be provided if you miss it.
There will be a Mega Seminar where you will work with Soni Mam to create a MIS Project with Dashboard.


Attitude Academy\'s MIS & Data Analytics course in Yamuna Vihar is top-notch! The trainers are highly experienced, and the practical sessions make learning fun. I’ve gained skills that are directly applicable to my career. Highly recommend!
Attitude Academy\'s MIS & Data Analytics course in Yamuna Vihar is top-notch! The trainers are highly experienced, and the practical sessions make learning fun. I’ve gained skills that are directly applicable to my career. Highly recommend!
Attitude Academy’s MIS & Data Analytics course has been a game-changer for my career! The trainers are highly knowledgeable, and the course covers all aspects of data management and analysis. The hands-on approach helped me apply my skills in real-world projects. Highly recommend this course to anyone looking to excel in data analytics!
I’ve been enrolled in the MIS & Data Analytics course at Attitude Academy for a few months, and I’m amazed at how quickly I’ve learned. The practical examples and assignments are spot-on, and I now feel confident analyzing large data sets. The instructors are supportive and always available to clarify doubts.
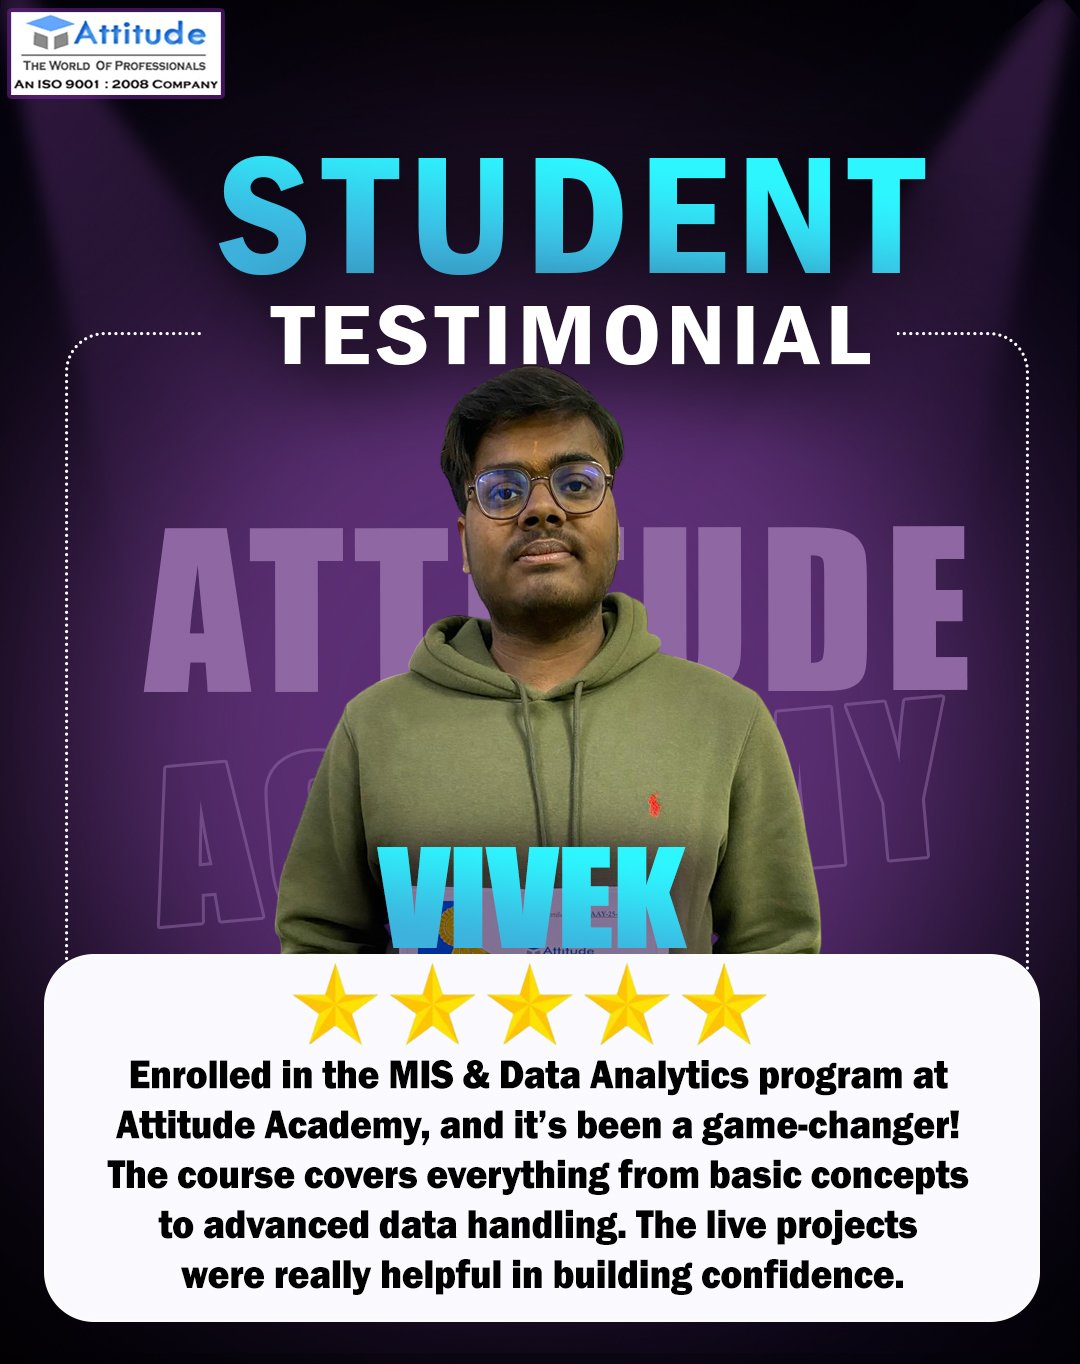
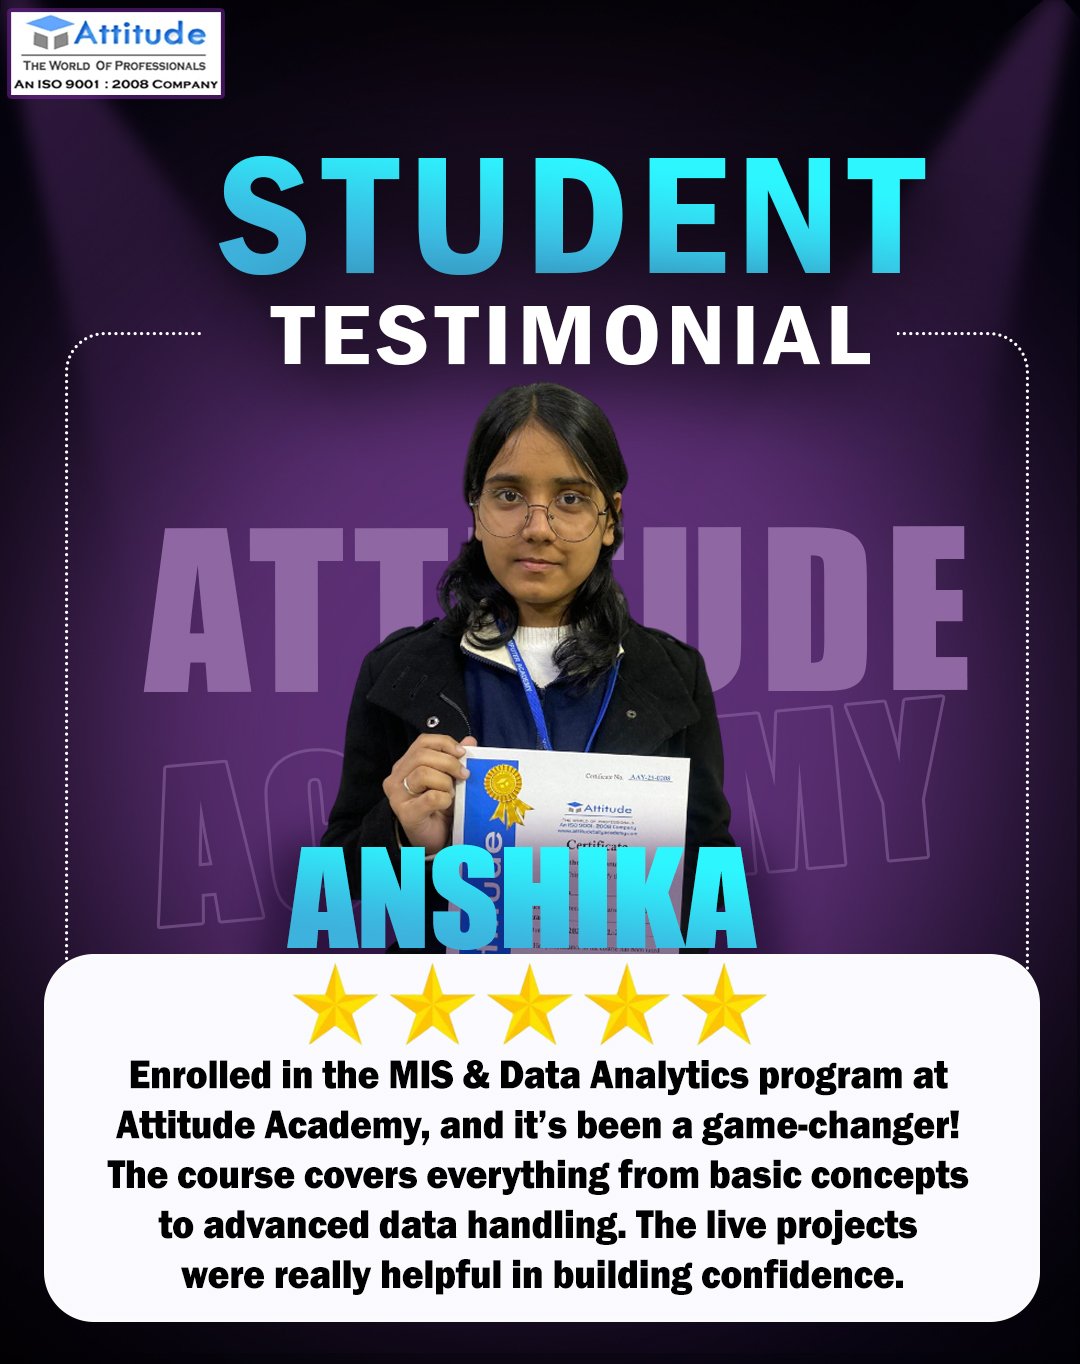
Enrolled in the MIS & Data Analytics program at Attitude Academy, and it’s been a game-changer! The course covers everything from basic concepts to advanced data handling. The live projects were really helpful in building confidence.
Attitude Academy\'s MIS & Data Analytics course in Yamuna Vihar is top-notch! The trainers are highly experienced, and the practical sessions make learning fun. I’ve gained skills that are directly applicable to my career. Highly recommend!
Attitude Academy’s MIS & Data Analytics course has been a game-changer for my career! The trainers are highly knowledgeable, and the course covers all aspects of data management and analysis. The hands-on approach helped me apply my skills in real-world projects. Highly recommend this course to anyone looking to excel in data analytics!
Enrolling in the MIS & Data Analytics program at Attitude Academy was one of the best decisions I’ve made for my career. The classes are well-organized, and the faculty is dedicated to helping students succeed. I’ve gained a lot of practical knowledge that I can apply directly to my job.
I’ve been enrolled in the MIS & Data Analytics course at Attitude Academy for a few months, and I’m amazed at how quickly I’ve learned. The practical examples and assignments are spot-on, and I now feel confident analyzing large data sets. The instructors are supportive and always available to clarify doubts.
I’ve been enrolled in the MIS & Data Analytics course at Attitude Academy for a few months, and I’m amazed at how quickly I’ve learned. The practical examples and assignments are spot-on, and I now feel confident analyzing large data sets. The instructors are supportive and always available to clarify doubts.
Attitude Academy’s MIS & Data Analytics course has been a game-changer for my career! The trainers are highly knowledgeable, and the course covers all aspects of data management and analysis. The hands-on approach helped me apply my skills in real-world projects. Highly recommend this course to anyone looking to excel in data analytics!
Enrolling in the MIS & Data Analytics program at Attitude Academy was one of the best decisions I’ve made for my career. The classes are well-organized, and the faculty is dedicated to helping students succeed. I’ve gained a lot of practical knowledge that I can apply directly to my job.
Enrolling in the MIS & Data Analytics program at Attitude Academy was one of the best decisions I’ve made for my career. The classes are well-organized, and the faculty is dedicated to helping students succeed. I’ve gained a lot of practical knowledge that I can apply directly to my job.

Enrolling in the MIS & Data Analytics program at Attitude Academy was one of the best decisions I’ve made for my career. The classes are well-organized, and the faculty is dedicated to helping students succeed. I’ve gained a lot of practical knowledge that I can apply directly to my job.
In today’s fast-paced digital world, traditional accounting methods are being replaced by smarter, faster, and more efficient online solutions. Our E-Accounting course will not only teach you how to manage finances but also help you master the tools that drive modern businesses.
Attitude Academy’s course on MIS & Data Analytics has exceeded all my expectations. The curriculum is well-structured, with real-time applications that make learning fun and engaging. The trainers ensure that every student gets individual attention, which helped me grasp concepts more effectively.

Attitude Academy’s course on MIS & Data Analytics has exceeded all my expectations. The curriculum is well-structured, with real-time applications that make learning fun and engaging. The trainers ensure that every student gets individual attention, which helped me grasp concepts more effectively.

Attitude Academy’s course on MIS & Data Analytics has exceeded all my expectations. The curriculum is well-structured, with real-time applications that make learning fun and engaging. The trainers ensure that every student gets individual attention, which helped me grasp concepts more effectively.

Attitude Academy\'s MIS & Data Analytics course in Yamuna Vihar is top-notch! The trainers are highly experienced, and the practical sessions make learning fun. I’ve gained skills that are directly applicable to my career. Highly recommend!
Enrolled in the MIS & Data Analytics program at Attitude Academy, and it’s been a game-changer! The course covers everything from basic concepts to advanced data handling. The live projects were really helpful in building confidence.

Rating
Student Trained
Years Experience
More than 3 years of Experience in MS-Office, Advanced Excel and MIS Reporting ANd Data Analytics.

We have answered all common questions below that you might have about the workshop.
For any further queries, please contact: hello@attitudetallyacademy.com