Placed Learners

Abhishek
Attitude academy offers high quality BASICS OF COMPUTER, MS-OFFICE AND ADVANCED EXCEL course that help you build a solid foundation at your career front. Trainers are experienced, supportive, and always eager to help and have deep knowledge of the subject. Practicals are done on regular basis in well equipped labs. I got placed right after my training. thank you ATTITUDE ACADEMY
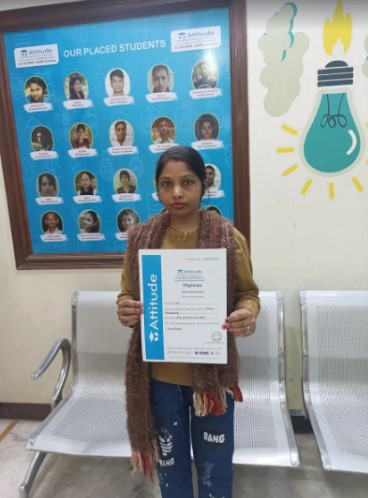
Lata Kashyap
Attitude Academy is the best training institute for fashion designing! I had the privilege of being mentored by experienced professionals who truly know their craft. The trainers are excellent and create a positive learning environment. I'm grateful for the skills and knowledge I gained here!

Tushar Thakur
I had an excellent experience at Attitude Academy in Yamuna Vihar! Their MIS Exceutive classes are truly the best in Yamuna Vihar, Delhi. The instructors are knowledgeable, patient, and supportive, making the learning process enjoyable. The academy's ambiance is conducive to learning, and they provide a great learning environment. If you're looking to enhance your computer skills, I highly recommend Attitude Academy. Five stars all the way!

Suhail Ansari
I had an excellent experience at Attitude Academy in Yamuna Vihar! Their Graphic Designing classes are truly the best in Yamuna Vihar, Delhi. The instructors are knowledgeable, patient, and supportive, making the learning process enjoyable. If you're looking to enhance your computer skills, I highly recommend Attitude Academy. Five stars all the way!

Kapil Verma
I had an excellent experience at Attitude Academy in Yamuna Vihar! Their Basic Computer classes are truly the best in Yamuna Vihar, Delhi. The instructors are knowledgeable, patient, and supportive, making the learning process enjoyable. The curriculum is well-structured, covering all the essential topics with practical hands-on exercises. The academy's ambiance is conducive to learning, and they provide a great learning environment. If you're looking to enhance your computer skills, I highly r
Ajay Verma
I recently completed the Financial e-Accounting program at Attitude Academy, and I must say, it was an exceptional educational journey. The course was both challenging and enriching, providing a deep dive into the subject matter. The instructors demonstrated profound expertise in their fields, and their passion for teaching was evident in every class. I highly recommend Financial e-Accounting at Attitude Academy to anyone seeking a top-notch education in a supportive and engaging atmosphere.
Dolly
This is one of the best institute for Autocad Training. I recommend everyone should study from Mohsin sir class and join his batch only, he is very knowledgeable and expert in this industry. He always explains the concepts very clearly and provides real life projects which helps to build a strong knowledge base, assignments given by him are excellent and very helpful to understand the concepts.

Mehak Mittal
I had enrolled in the Graphic Designing training Course. The course was well taught by the trainer and the learning environment was great. they provide best and updated Study material and Give training on real industry assignments , they give opportunity hands on practice on real industry Projects. I also want to thank Leena mam for conducting Job skills, Interview handling skills session for helping facing interviews
Sakshi
This is one of the best institute for Graphic Designing and Web Designing Training. I recommend everyone should study from Shiraz Haider sir class and join his batch only, he is very knowledgeable and expert in this industry. He always explains the concepts very clearly and provides real life projects which helps to build a strong knowledge base, assignments given by him are excellent and very helpful to understand the concepts.
Kusum Yadav
This is one of the best institute for MIS Training. I recommend everyone should study from Soni Mam class and join her batch only, She is very knowledgeable and expert in this industry. She always explains the concepts very clearly and provides real life projects which helps to build a strong knowledge base, assignments given by him are excellent and very helpful to understand the concepts.

Faliha
It has been a great experience for me to take fashion and dress designing training from attitude academy. I have taken fashion and dress designing course .the trainer especially anjali mam is very good and has good knowledge. I have also got a placement from here. Thanks Team Attitude Academy!

Piyush
Attitutde Academy is undeniably the best place for AutoCAD training institute in Yamuna Viahr, and I wholeheartedly endorse Sumit Sir's class. His expertise and industry knowledge are unparalleled. Sumit Sir excels in delivering crystal-clear explanations of AutoCAD concepts. His real-life projects and excellent assignments are instrumental in building a solid knowledge foundation. If you're seeking top-notch AutoCAD training, don't look elsewhere. Join Sumit Sir's class at Attitude Academy.
Aashu
I recently completed the Interior Designing training course at Attitude Academy, and it exceeded my expectations. The trainer's expertise and the excellent learning environment made the experience remarkable. The study material was top-notch, always up-to-date. Real industry assignments and hands-on projects provided invaluable practical experience. I'm grateful to Kajal mam for her job skills and interview handling sessions, which boosted my confidence.

It has been a great experience for me to take Autocad 3d's Max training from Attitude Academy. I have taken Autocad course. The trainer especially Sumit Sir is very good and has good knowledge. I have also got a placement from here. The placement team is very good especially the Kajal Mam is very helpful and provide good support in getting placement. Thanks Team Attitude Academy.

AutoCAD course was a fantastic opportunity for me to learn lots of new things and I am so delighted that I could have this course since I always wanted to go through this course. From the very first moment that I started the course I tried to use all those thing that I learned over the course and I am so happy for that. Attitude Academy is the best training institute in Yamuna Vihar.

Suraj
It has been a great experience for me to take Autocad 3d's Max training from Attitude Academy. I have taken Autocad course. The trainer especially Mohsin Sir is very good and has good knowledge. I have also got a placement from here. The placement team is very good especially the Palak Mam is very helpful and provide good support in getting placement. Thanks Team Attitude Academy.

Dilip
I had enrolled in the Interior Designing training Course. The course was well taught by the trainer and the learning environment was great. they provide best and updated Study material and Give training on real industry assignments , they give opportunity hands on practice on real industry Projects. I also want to thank Leena mam for conducting Job skills, Interview handling skills session for helping facing interviews.

Shiva
It was such a great experience to study AutoCAD course, I have learned a lot about my strengths and weaknesses with the help of my amazing tutors. Now I believe I am more capable of teaching different skills effectively.

Tipu
Attitude Academy is great place to learn. It gives me great to say with pride that, I have completed my Graphics Designing Course from Attitude Academy. The relationship between facilities and student is very cordial, which gave me an opportunity to excel in my area of interest

Shubham Chauhan
I am proud that I could participate this amazing course at the amazing Attitude Academy. It was an honor to work with knowledgeable tutors who helped us in all the ways possible. All I can say is Thank you Attitude Academy!

Monika Dhaka
This course was a fantastic opportunity for me to learn lots of new things and I am so delighted that I could have this course since I always wanted to go through this course. From the very first moment that I started the course I tried to use all those thing that I learned over the course and I am so happy for that.

Yash
This is ine of the beat institute for AutoCAD Training. I recommend everyone should study from Mandeep Sir class and join his batch only, he is very knowledgeable and expert in this industry he always explain the concept very clearly and provides real life project which helps to build a strong knowledge base assignments given by excellent and very helpful to understand the concepts.
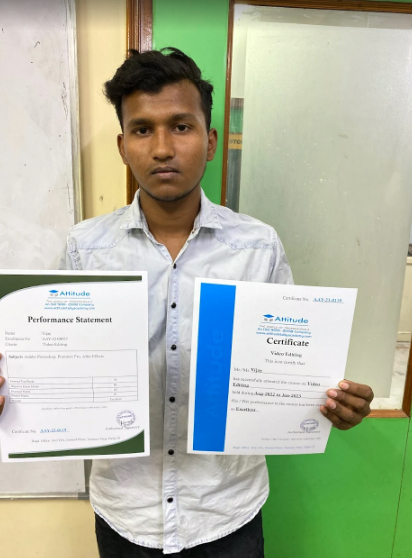
Vijay
I am proud that I could participate this amazing course at the amazing Attitude Academy. It was an honor to work with knowledgeable tutors who helped us in all the ways possible. All I can say is Thank you Attitude Academy!
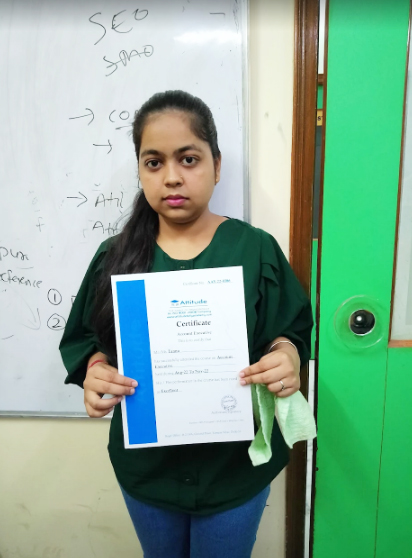
Tannu Bhagel
Attitude Academy is a practical technical institute and offers an ideal study environment for those who want experience both professionally and educationally. I found myself what I want to do in the future – to become an Accountant. I realized that both professional experience and higher education are important to achieve my future goal.

Tanuj
3 weeks ago NEW I enjoyed the course because the tutors are enthusiastic people who put an effort to let students' understand the materials and they showed me that it is enjoyable to be a teacher. Attitude Academy is very helpful and provide good support in getting placement. Thanks Team Attitude Academy

Deepak course
Being a student at Attitude Academy Yamuna Vihar as a super over experience. I am perceiving in financial accounting course I spend six month in this institute. I learnt so many things here there is not been academic also extra curriculum activities and at the end of the journey I was a completely different person, more confident, self dependent able to do anything by on able to face the world. Take on challenges and always smile Moka Milta

Ankita Baghel
Attitude Academy is great place to learn. It gives me great to say with pride that, I have completed my Graphics Designing Course from Attitude Academy.The relationship between faculities and student is very cordial, which gave me an opportunity to excel in my area of interest

Ravi ranjan tiwari
It has been a great experience for me to take Website designing training from Attitude Academy. I have taken Website Designing and development course. The trainer especially Shiraz Sir is very good and has good knowledge.

Kuldeep Kumar
It has been a great experience for me to take Digital Marketing training from Attitude Academy. I have taken Digital Marketing Classes. The trainer especially Naresh Sir is very good and has good knowledge. I have also got a placement from here. The placement team is very good especially the Palak Mam is very helpful and provide good support in getting placement. Thanks Team Attitude Academy.
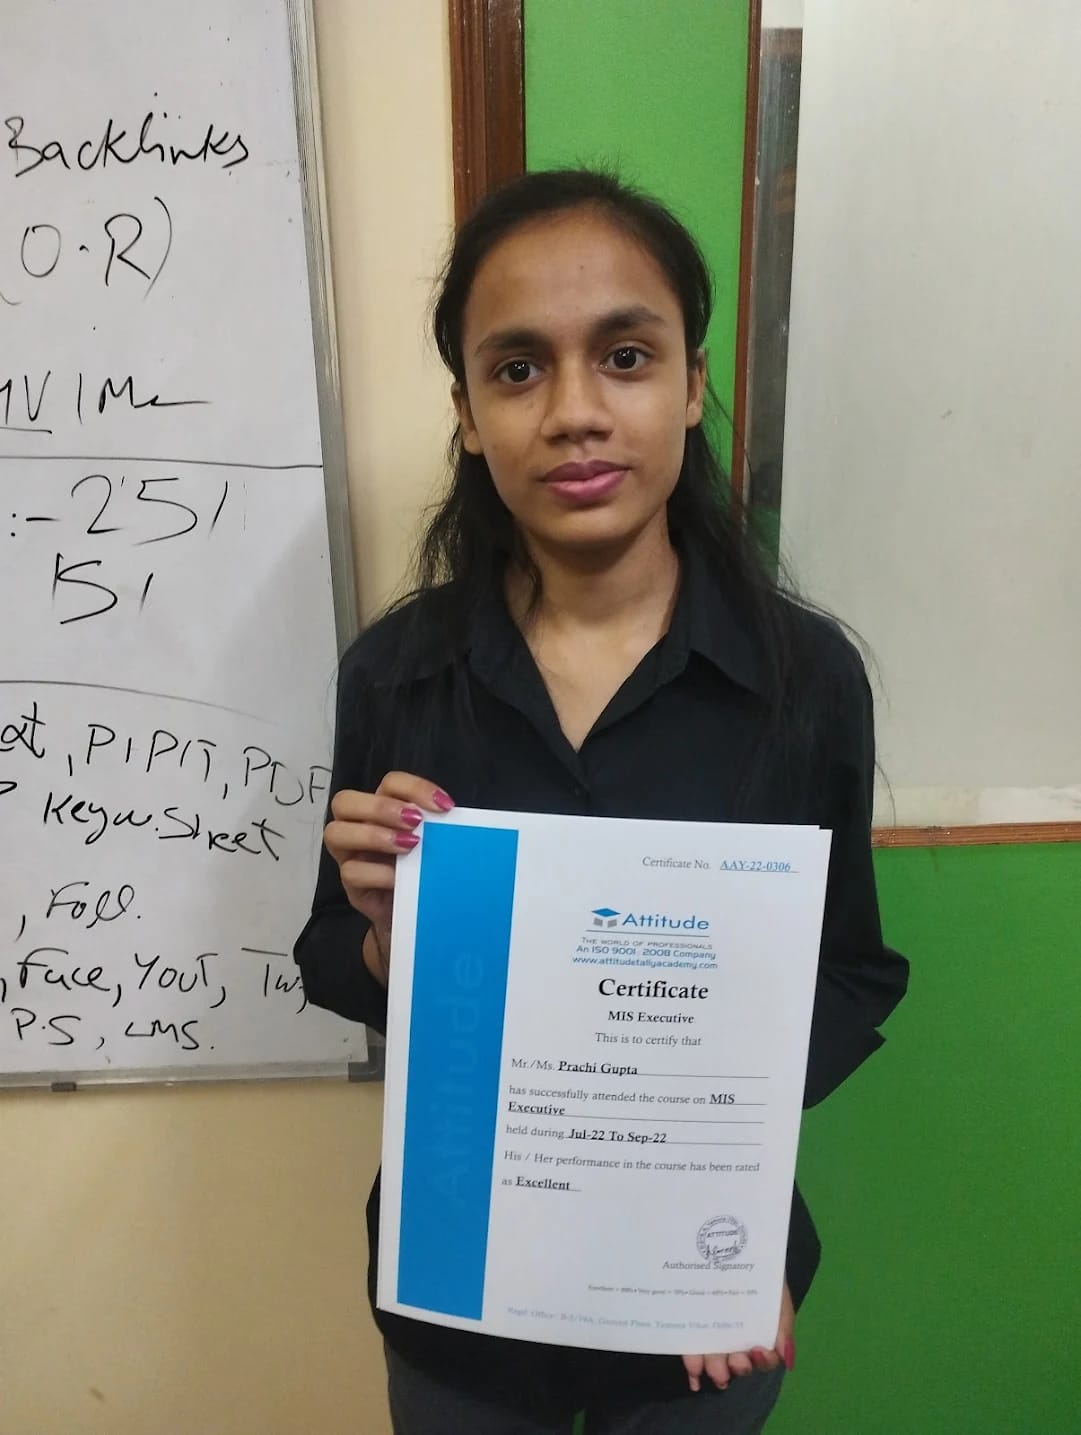
Prachi Gupta
This is one of the best institute for BOC Training. I recommend everyone should study from Ruchika Mam class and join her batch only, She is very knowledgeable and expert in this industry. She always explains the concepts very clearly and provides real life projects which helps to build a strong knowledge base, assignments given by him are excellent and very helpful to understand the concepts.

VIJAY V
I have got certified by Attitude Academy in Multimedia Expert course and I am very Thankful to Shiraz Haider sir & Team for supporting me. I am from Tamilnadu, taken Live classes & I have learnt successfully & got very good course material, Their teaching method is excellent, I would like to suggest everyone to join Attitude Academy.

savita mishra
It's perfect for beginners. In this course, you can learn how to improve your designs and give them a professional look! job support is great tool of attitude academy i love it.... thanks for helping me in my first job placement
.png)
rohit baliyan
I've been learning and working in graphic design for many years. I actually picked up so many tips to make my designs look better! I love that trainer is always saying the shortcuts and where to find certain things in the programs. I have never used Illustrator so it was pretty cool seeing that program in action. I really enjoyed the course and recommend it! thanks attitude academy

anand gandhi
Had a great experience with the course, the classes touch upon both the functional and theoretical aspects of programming, and the care in responding to questions as well as obvious dedication to continue updating and improving the course are very motivating.

Preeti goel
Very professional. Honestly, this is about 2 courses worth of python in 1 course (in my opinion). Good pace, clear content, builds on each topic.

varun
This course was one of few courses in python which i took. I must say nothing was more comprehensive and exhaustive like this. Attitude Academy goes into each and concept and talks about it in detail. At times it was overbearing but if you are able to complete it - you would have got valuable insights into the dynamics of python. I use this material as a reference. I am glad that i took this course! Thank you guys
.png)
Avinash
Yes, This is the good session for me. I learned multiple things in this session like sentence formation, how can i used a,an,the articles and wh questions like where, who, what, how.....
.png)
ankit sharma
i joined the english speaking course because i wanted to learn english properly and improve my level of english .when i joined udemy ,i experienced a lot of thing and i gained a lot of knowledge about english. i got confidence too and now i am able to speak english .
.png)
gaurav
This MS Excel course is very student friendly and easy to cope up with our daily work schedule.attitude academy has done an excellent job in presenting the content in simple way covering almost all the topics from beginner level to VBA.

Ronak Sharma
While starting the course I was lacking motivation but as I learned to go with flow and explored different topics, faculty at Attitude Academy helped me by taking care of all the doubts. Thus, ensuring my clarity in the subjects.

Avinash
My experience with Attitude Academy has been great. Now, I can say that I have a strong foundation in programming, This course gave me a taste of developing websites which helped me build some interesting projects for my portfolio.

sahil dubey
I have completed the Android Development Course from Attitude Academy and it has been a game-changer in my life. The topics and assignments in the course were the key aspects that transformed my knowledge about Android Studio. Thanks Attitude Academy
Sujit Kumar
My experience with Attitude Academy has been amazing. The course gave immense knowledge about the subject which helped me gain confidence in learning the complex topics. I have had exceptional mentor support from Attitude Academy.

NIkhil Goswami
Best academy for smart courses and good facilities

Aucky Kumar
one of the best institute have ever seen .... even teachers are so much coperative... online class LMS portal is best for learning

Akash
Attitude Academy is one of the best Academy to learn Tally, GST, Basic of Computers. Faculty of this institute are very cooperative, polite and humble with their students. The best part of this institute is they provide online lerning facilities

Sageer
Attitude academy is the best institute of Tally ERP9 with GST and Accounting in delhi. trainers are very helpful.

Kavya
I am learning sketching here by Divya mam in this institute in fashion designing course..

Rishi Mishra
i am an accountant by profession and the hole credit goes to Attitude tally academy , specially Turab sir.. here i got basic to excellence knowledge of accounting

sanjeev
Excellent institute. I would like to recommend it to everyone l know.

Aarohi Thakur
Nice fashion design academy in uttam nagar. Iam doing my dress and fashion design course from attitude academy in uttam nagar thanks to all my friends.

Hema papnoi
One of the good thing about this academy is that students have the opportunity to work on live projects & online classes also, which is industry's current demand.

Sumant
Hi, My name is Sumant. I am a student of Attitude Academy. I am Learning Advance MS Excel here. Teachers are very supported. Overall good experience here & online LMS is best of this academy.
Namrita
I am very much impressed with the faculty, the way of teaching and the most important and impressive is the real time project work which is 100% practical.
Manisha
Wonderful dresses I am stitching for myself, my family and the institute, after learning dress designing from this institute. So happy...
Mahima
Best FD and DD, I am doing 6 months course from here, Anjali and Divya mam are best. Such an experienced and great faculty of fashion and dress designing here.
Gourav
Mamta mam is best Tally GST Taxation trainer. Learning e-accounting in this institute in a better way.

Laxmi
I have Completed my Tally.ERP9 Course with good experience. And now I feel that I am very confident about my interview and job.
